Excel: Understanding Colors
In Excel, you can change the color of data and objects. When you opt to change a color, Excel presents you with a color gallery that has three categories: Theme Colors, Standard Colors, and More Colors. This section will provide you with an overview of color options. In the next two sections, you will learn how to change the fill color and the font color. Future lessons will show you how to change the color of other objects.
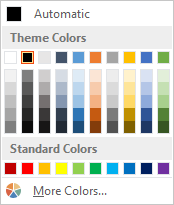
Theme Colors
Theme colors display sets of colors you can use throughout a document or set of documents. Used regularly, they give your documents a consistent look and feel. A set of colors is associated with every theme. If you are not familiar with themes, do not worry. Just know that with theme colors, if you change the theme, the data or object color may also change. If you have not changed the theme or color set, you are working with the default theme and the default color set.
Standard Colors
Standard colors are a set of popular colors. With standard colors, when you change your theme, the data or object color stays the same.
More Colors
The More Colors option opens the Colors dialog box. You can use the Colors dialog box to apply any color you want. If you apply a color by using the More Colors option, when you change your theme, the data or object color stays the same.
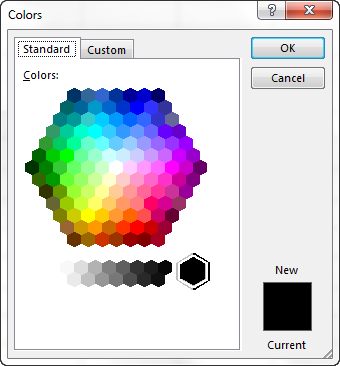
Standard Tab
When using the Colors dialog box, choose the Standard tab to click on a color to select it.
Custom Tab
When using the Colors dialog box, choose the Custom tab to select a color by using the RGB or HSL model. Many programs use either the RGB or the HSL model. As such, you may want to use one of these models if you are trying to match a color created by another program.
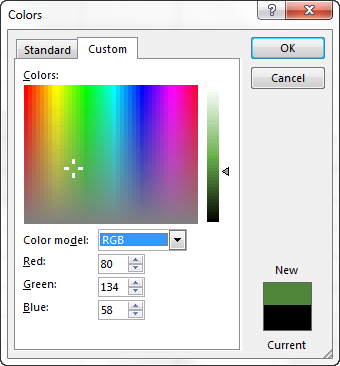
The RGB Model
RGB stands for Red Green Blue. This model uses combinations of the three primary colors red, green, and blue to create all of the colors a computer monitor can display. Each of the primary colors has a range of values from 0 to 255. Setting all three values to 0 produces black; setting all three values to 255 produces white. By adjusting the Red, Green, and Blue values, you can produce the full spectrum of colors.
The HSL Model
HSL stands for Hue Saturation Luminosity. Each of these elements is assigned a value from 0 to 255. Hue is a color or shade of color. Saturation refers to the amount of gray in a color; a saturation value of 0 adds a lot of gray, and a saturation value of 255 adds no gray. Luminosity refers to the amount or intensity of light found in a color; a luminosity setting of 0 is equal to black, and a luminosity setting of 255 is equal to white. Adjusting the Hue, Saturation, and Luminosity produces the full spectrum of colors.
Removing Color
To remove color, open the color gallery, and then click No Color. Excel removes the color. The Font Color button does not have a No Color option. To change the color of data back to the default color, press the down-arrow next to the Font Color button and then click Automatic.
Leave a Comment